
The latest research on the phenomenon of monster waves in an extract from the new book Rogue Waves by Michael Olagnon and Janette Kerr.
The first oceanographer to define a wave as ‘freak’ was Laurence Draper, a man who preferred to do his science on dry land rather than at sea.
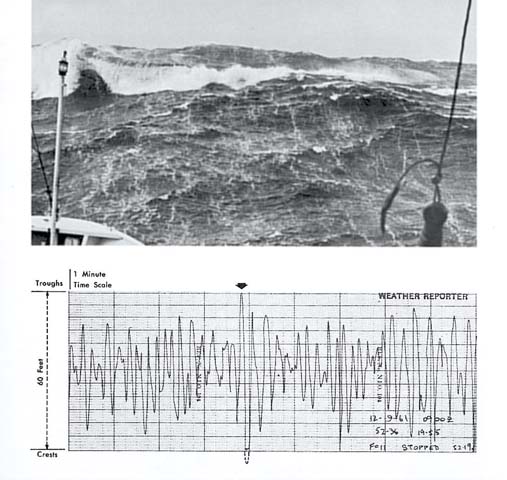
While his colleagues were enjoying their 1963 Christmas Eve party at the National Institute of Oceanography in Southampton, Laurie Draper, scenting a scientific discovery, was busy analysing recordings made aboard a British weather ship in the North Atlantic.
See also: part 1 of Yachting World’s rogue wave special report – real-life stories.
Since 1950 these ships, consigned to pre-determined fixed positions, were equipped with recorders using paper drums that measured ocean waves according to the vertical rise and fall of the ship and the pressure on its hull.
Set at first to a maximum recording of 15 metres (50ft), the recorders were soon modified to accommodate waves up to 18 metres (60ft).
For nine years the resultant range was considered adequate, but at 0900 on the morning of 12 September 1961, aboard the ship Weather Reporter, positioned close to the aftermath of Hurricane Betsy, the recorder went off the scale. By adjusting the missing part of the crest, an estimate was arrived at of a wave height, crest to trough, of 20 metres (67ft).
In this monster, which he found that Christmas Eve [two years later], Draper did not see a statistical anomaly, but simply the proof that accounts of enormous waves, often doubted, were perfectly credible.
What is a rogue wave?
What we need is a scientific definition, but unfortunately it is difficult to find one on which everyone agrees.

Amer Sports Too in tough conditions off Cape of Good Hope, South Africa during Leg 2 of the Volvo Ocean Race, 2001-2002.
A rogue wave is a wave of a size and severity which one would not expect, given the prevailing conditions; that is the basis which nobody disputes.
Beyond that, there are two schools of thought: one based on minimum height, with the assumption that this also covers its severity, and the other which attempts to distinguish, by virtue of particular characteristics, abnormal waves within a population of predominantly ‘normal’ waves.
For a long time the maximum height of ocean waves has been used to describe a sea state, but today the so-called significant wave height is preferred.
- The significant wave height is the average height of the biggest third of waves. This definition excludes small waves for which the crest and the trough are not respectively either above or below the mean water level.
- The biggest waves are selected and the top third averaged.
- If one were to take all waves into account, only one in ten would exceed the significant wave height.
- It can be calculated that the significant wave height is 4.004 times higher than the [water surface elevation].
- In practice, then, we use four times the typical wave height.
A definition based on the crossing of a height threshold – say, twice the significant wave-height – is attractive, but what is the probability of that threshold being crossed?
The probability of waves exceeding the significant wave height
On average, one wave in ten exceeds the significant wave height, one in 100 is 1.52 times higher, and one in 1,000 is 1.86 times higher.
A typical recording made by a measuring buoy lasts about 20 minutes, which in the North Sea corresponds usually to about 180 waves, reducing to as few as a hundred in severe conditions when the waves have a longer period.
One wave in 180 will exceed, on average, the significant wave height by 1.61 times, and so that is what is expected as the maximum for such a recording.
To measure a wave of more than twice the significant wave height would therefore appear, at first glance, to be quite surprising. This definition, based on a threshold of double, or sometimes a little more, is the one currently used to define a rogue wave.
It needs a group of 3,000 waves to reach a factor of twice the significant wave height – a rate of occurrence one might have thought unattainable on a single day of storm conditions, when the wave periods and lengths are greater, and considerably less in normal conditions.
Moreover, this takes no account of the interactions between waves, which, as an engineer is capable of calculating, can increase, with fatal consequences, the probability of even higher waves.
The black swan or freak occurrence wave
The severity of a wave is not simply a question of its height, but of other factors as well, such as its steepness – the ratio of its height to its length – and its period (which determines the speed at which the wave rises), the horizontal speeds in the crest, the severity of the slope of its free surface, or its likelihood of breaking and therefore falling on the foredeck of a ship or rolling a small boat.

We can start to see, then, another definition of a rogue wave. The ‘black swan’, the almost impossible event, one which according to past observation could only happen extremely rarely, but which in fact is much less rare than one imagines (although as regards rogue waves this has still to be proven).
This definition is very seductive for the scientist, but very difficult to apply in practice. Extreme waves are not simply black or white, normal or rogue, identifiable by certain individual characteristics. There is a smooth continuum between sub-extreme waves and truly extreme ones, and even face-to-face with a given wave it would be impossible to know which type it was.
In the absence of a consensus, we will stick to the notion that a rogue wave is a wave whose severity, in relation to the other waves in the same place at the same time, surprises the expert.
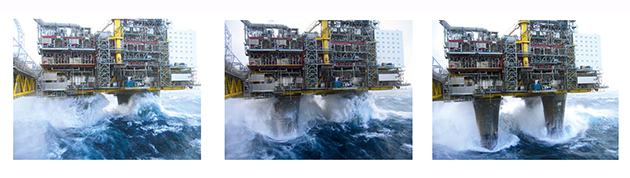
The Draupner wave – North Sea 1995
The measurements of the New Year’s Day wave of 1995 opened a new era in research on rogue waves. Marine weather manager for the Norwegian oil company Statoil, Sverre Haver takes up the story:
“During the autumn of 1994 some maintenance work was ongoing on one of the two Draupner platforms. A scaffold was installed under the platform deck.
“The work had to stop for the winter season and the question was: could the scaffold remain under the platform without being impacted by waves?
“I had to make the assessment as to whether there was sufficient distance between the still water level and the scaffold. By adding the estimated 10,000-year height and our estimated 10,000-year crest height, I concluded that the scaffold could stay over winter because the 10,000-year crest was not expected to hit the deck. Clearance was, however, marginal – maybe 10cm (4in).
“On New Year’s Day 1995 there was a rather intense storm in the North Sea. On the morning of 2 January I got a phone call from the unit operating the platform with the message: ‘We have experienced a 10,000-year wave!’
Understanding the explosive increase in wave height
“By coincidence a wave radar was installed at the platform. It was not a part of our routine collection of met-ocean information.
“We had no online connection to the radar. But later that year somebody sent me processed data for the storm.
“The storm severity was not particularly impressive – its return period was probably around 10 years, and so it should not have represented any threat to the scaffold. But when I saw the time trace for the extreme wave of the storm, my first word was ‘Wow!’ (or rather the Norwegian equivalent).
“If it was not for the fact that the platform had reported a majestic wave event, I would have concluded that it was erroneous measurements.
“Immediately afterwards we increased our focus on the prediction of the necessary air gap. We also presented this event at various conferences, resulting in an increased focus on the modelling of the sea surface elevation.
“Whether the Draupner wave was a freak wave or simply a very rare event in a non-freak population is not yet answered with confidence.”
What all waves have in common
Ocean waves in deep water have a remarkable characteristic: they are dispersive waves, which propagate at speeds which vary according to their wavelength.
The longest wavelengths travel the quickest, the shortest the least quickly, this being proportional to the square root. For those who have only watched waves from the shore, this seems counterintuitive, as in shallow water the speed is the same for all waves.
In deep water the main characteristic of dispersive waves is the difference in their speed according to their wavelength.
At the heart of a generative storm, waves leave over a long period of time, from widely spread starting points.
It is like a pursuit race: if their points and timing of departure happen to be favourably arranged, a large number can arrive at the same point at the same moment. This concentration of primary wave motions, which can easily be recreated in a test tank, causes extreme waves.
These interactions between waves have been known for a long time, and allow us to make approximations about the way waves develop which have margins of error that are so small that, in relation to big combinations of waves, they become negligible.
This is the case, for example, as regards the steepness of waves or their height relative to the depth of water.
In reality there is an infinite number of possible combinations. Clearly rogue waves are so rare that even if we laid hundreds, or even thousands, of observation buoys, there would still be little expectation of actually registering a rogue wave.
Rollers of death: Cape Agulhas
Cape Agulhas, a hundred or so kilometres to the east of the Cape of Good Hope, is the southernmost point of Africa and marks the division between the Atlantic and Indian Oceans.
It is also the meeting place of two formidable ocean currents: the Benguela Current from the Atlantic which turns northwards towards the Gulf of Guinea, and the Agulhas Current which alters course to flow east once it reaches the Roaring Forties.
Storms far south of the Cape generate huge swells running north-east. When a swell is contrary to a current, its lower part is slowed down, the swell lifts and it can even break.
Moreover, if the current is stronger at its centre than closer to the coast, the line of the swells will curve into a crescent shape and converge back on itself. As the current curves, its refraction will either increase or decrease its energy, depending on local conditions.
Where the energy builds up, pyramid-shaped waves called Cape Rollers, whose height and steepness make them particularly dangerous, can appear.
Breaking waves and the 100-fathom line
The merchant mariners’ ancient warning reads: ‘Beware the 100-fathom line!’ There are terrifying accounts of shipwrecks caused by monstrous waves which have appeared in depths between 150-200 metres (490-650 feet), or 100 fathoms.
The effect of the sea bed begins to make itself felt when the depth is less than the half-length of the wave. The English fathom of 6 feet is equivalent to 1.82 metres (the French to 1.62 metres), so 100 fathoms is equivalent to between 160-180 metres.
Ocean waves which have this measure for their half-length have a corresponding wave period of about 15 seconds; it needs a strong storm to exceed this. One can therefore conjecture that some ocean waves, the longest and therefore already the highest, are affected and amplified by the sea bed, while others are not.

Large rough seas in the Drake Passage
Chance of encountering a rogue
Drawing on Olagnon’s book and the real-life rogue wave encounters published in the May issue of Yachting World there are still plenty of unanswered questions…
If, as Olagnon’s book suggests, rogue waves might not be the freak occurrence initially thought, how likely are we as sailors to encounter them?
At the moment it isn’t known whether there are more rogue waves than previously thought, or we simply hear of more incidents because vessels from small yachts to ships have become so much better at surviving them.
Previous scientific attempts to predict the likelihood of rogue waves have failed because they were based on a cumulative, linear build up of wave heights.
In the summer of 2016, Professor Francesco Fedele at Georgia Tech, USA created a mathematical model that successfully predicted known rogue waves, including the Draupner wave, from the rec0rded conditions of the time, based on non-linear dynamics of irregular waves and troughs.
Without vastly more oceanic data, we are a long way off being able to forecast rogue waves, but it is telling that before his yacht Vyndi’s dismasting, experienced South African skipper Rod Briggs recalled “a very strange sea state”. Whilst some rogues will literally be out of the blue, sailors trusting their own observations of wave patterns may provide the biggest warning of their likelihood.

Rogue Waves Anatomy of a Monster by Michel Olagnon is published by Bloomsbury.